obsessedquant
Data-driven market analysis through volatility, price ranges, and regime classification.
The ATR Regime Dashboard provides a structured view of market
volatility using Average True Range calculations, expected
price boundaries, and current market conditions.
Use the dashboard to review ATR-based price ranges, compare
assets, and identify changing volatility regimes.
Click the project below to open the dashboard.
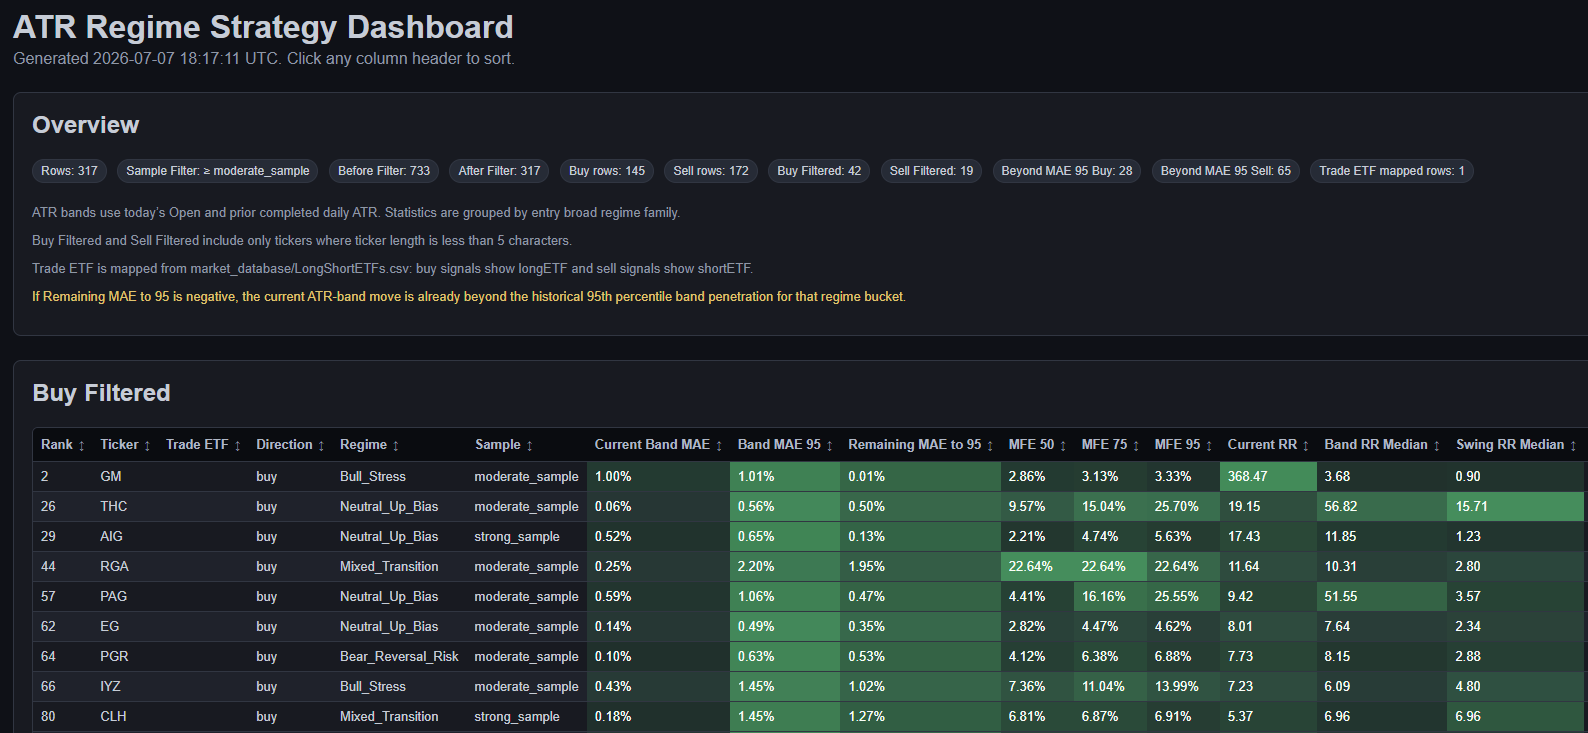
ATR Regime Dashboard
An interactive market dashboard that uses Average True Range data to calculate expected price boundaries, compare current volatility conditions, and identify changing market regimes.