The purpose of this project is to track and analyze the various economic indicators and metrics. Once all of the metrics have been compiled, then machine learning will be applied to identify the principle components with the aim of predicting when market conditions will change for portfolio risk management.
The data has been pulled from the various official sources and Python has been used for the data cleanining, crunching, and visualizations.
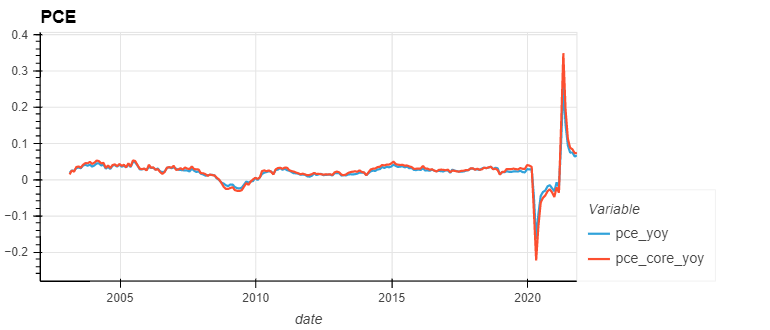
During the pandemic dump of March 2020, it can clearly be seen that PCE dropped massively year over year (YoY). The Core PCE (exluding food and energy) reported in April of 2020 fell 22.3% YoY, while PCE including food and energy fell 16.4% YoY.
Because of the very large drop in 2020, the YoY numbers for 2021 were historically very large. As reported in April 2021, the Core PCE came out to +34.8% YoY and the PCE including energy and food was +25.4% YoY.