The purpose of this project is to explore machine learning applications including supervised, unsupervised, and deep learning methodologies and identify trends that cannot be visualized in easily in 2-D and 3-D space.
These projects will be ongoing as optimal machine learning models require trial and error to improve upon.
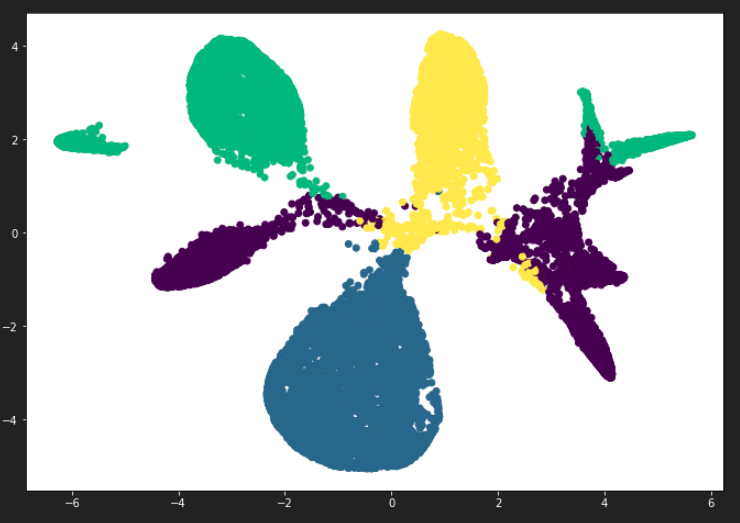
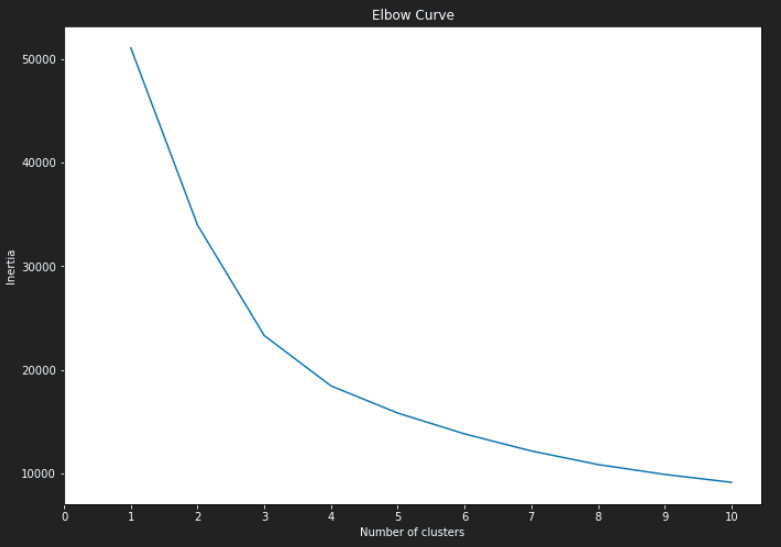
Unsupervised machine learning methods were used to evaluate clusters within the data set. The methods used for this analysis include principle components analysis (PCA), k-Means elbow curve, and t-SNE for clustering visualization.
Raw daily S&P500 price and volume data was taken from 1928 to 2021. The data was cleaned, formatted, and calculations for daily price changes, average true range (ATR), and relative volume were computed. ATR is a measure of volatility based on price spread fluctuations. Also, columns were added which logged the number of days in a row that price or volatility increased.
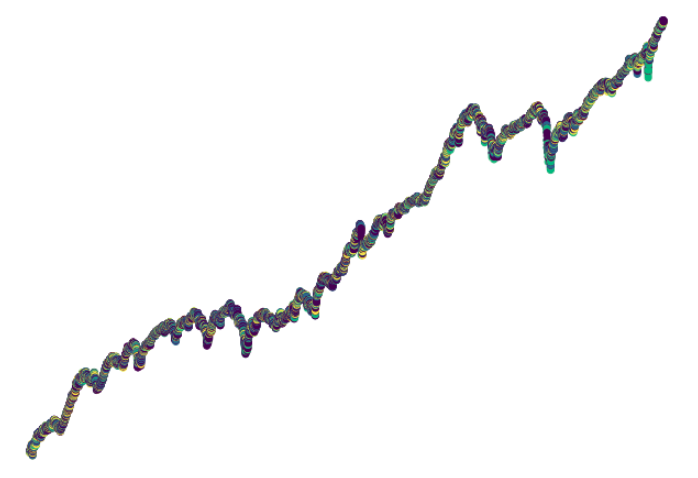
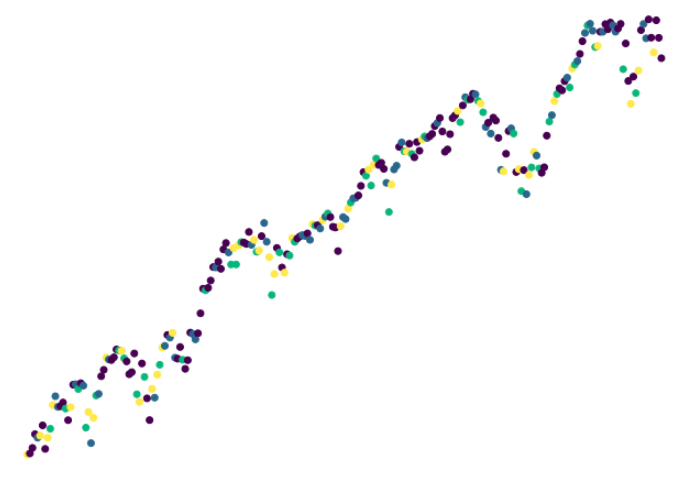
The elbow curve derived from k-Means analysis suggests the optimal number of clusters to be 4. The 4 clusters were input to a k-Means prediction model to produce the class labels for the original data set.


