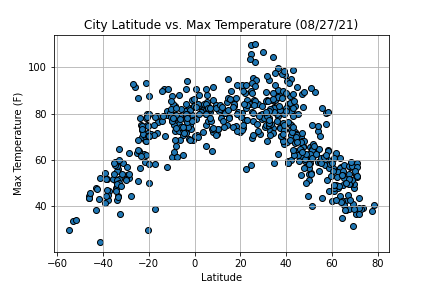
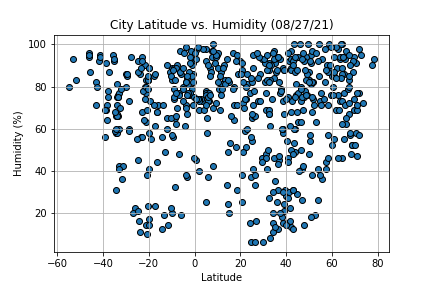
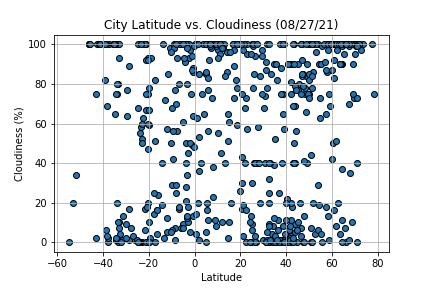
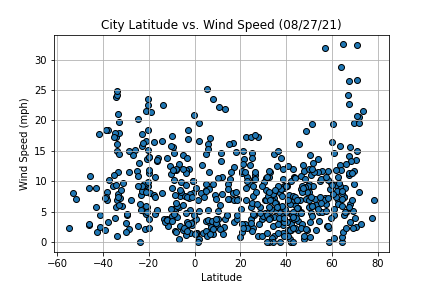
The purpose of this project was to analyze how weather changes in proximity to the equator. To accomplish this analysis, data was pulled from the OpenWeatherMap API to assemble a dataset on over 500 cities around the world.
After assembling the dataset, Matplotlib was used to plot various aspects of the weather vs. latitude. Observed factors included: temperature, cloudiness, wind speed, and humidity. This site provides the source data and visualizations created as part of the analysis, and includes explanations and descriptions of any observed trends and correlations.
Summary: Latitude vs. X

Visualizations